In the fast-moving world of digital marketing, transparency and clear communication are non-negotiable—especially when it comes to reporting. Monthly reports are more than a routine deliverable; they are an opportunity to reinforce the value of your services, build trust with clients, and provide strategic insight that drives long-term success. Reporting = Renewals. I’m going to say that again, reporting equals renewals! Providing quality reporting isn’t just good customer service, it is a critical component to retaining and upselling your clients.
Key Takeaways
✔ Managing Reporting Expectations- Reports are one of the BIG advantages we have over many competitors. Letting your client know what to expect from Monthly Reports is essential, nobody likes surprises or having to explain them in reports.
✔ How to Read and Explain Your Reports- Read them, understand them, and don't just email them. Explain them!
✔ Beyond the Numbers- Numbers are amazing, but what they mean and how they stack up against the client's expectations of the campaign is the key to reporting success.
Yet too often, reports are simply emailed over without context, analysis, or a human touch. If your clients don’t understand the metrics, can’t interpret what they mean, or don’t see the return on investment, you risk losing their confidence—and their business.
Presenting monthly reports with confidence can empower your clients, deepen relationships, and make you an invaluable marketing partner. But, how to do this….?
Set the Stage Before the Campaign Begins
Before you even run the first ad impression, your clients need to know what to expect in their reports. One of the most effective ways to do this is by giving them a sample report upfront (located in your Vici Drive). This helps clarify:
· What metrics will be included
· What metrics won’t be tracked
· How data will be presented
· Which platforms provide more detailed insights
· Send a Sample Report for the product in their campaigns
Setting these expectations early prevents confusion and builds confidence from the start!
Don’t Just Send Reports—Review Them
The biggest mistake marketers make is emailing the monthly report and considering the job done. A static PDF or dashboard link without explanation leaves clients to interpret results on their own—and that rarely ends well. Instead, schedule time to review the report together. Use this opportunity to:
· Walk through each section
· Highlight wins and areas for improvement
· Answer client questions in real-time
· Reinforce strategy and next steps
Think of this review as a mini-strategy session rather than a data dump. Your goal is to help the client understand what the numbers mean and feel good about the progress made.
Understand What’s Included in the Monthly Reports
Not all metrics are created equal, and not all platforms report the same way. Here are some of the standard items you'll typically find in a monthly digital marketing report:
· Product Breakdown
· Impressions, Clicks, CTR, Engagement Rate
· Top-performing websites or apps
· Platform-specific performance (e.g., CTV, PPC)
It’s important to humanize the data and metrics. Tell a story. Connect the dots for the client. I like to use the cover page as an opportunity to do this while providing a high-level executive summary at the same time. Walk slowly thru the process for them. For example, take this report’s cover page:
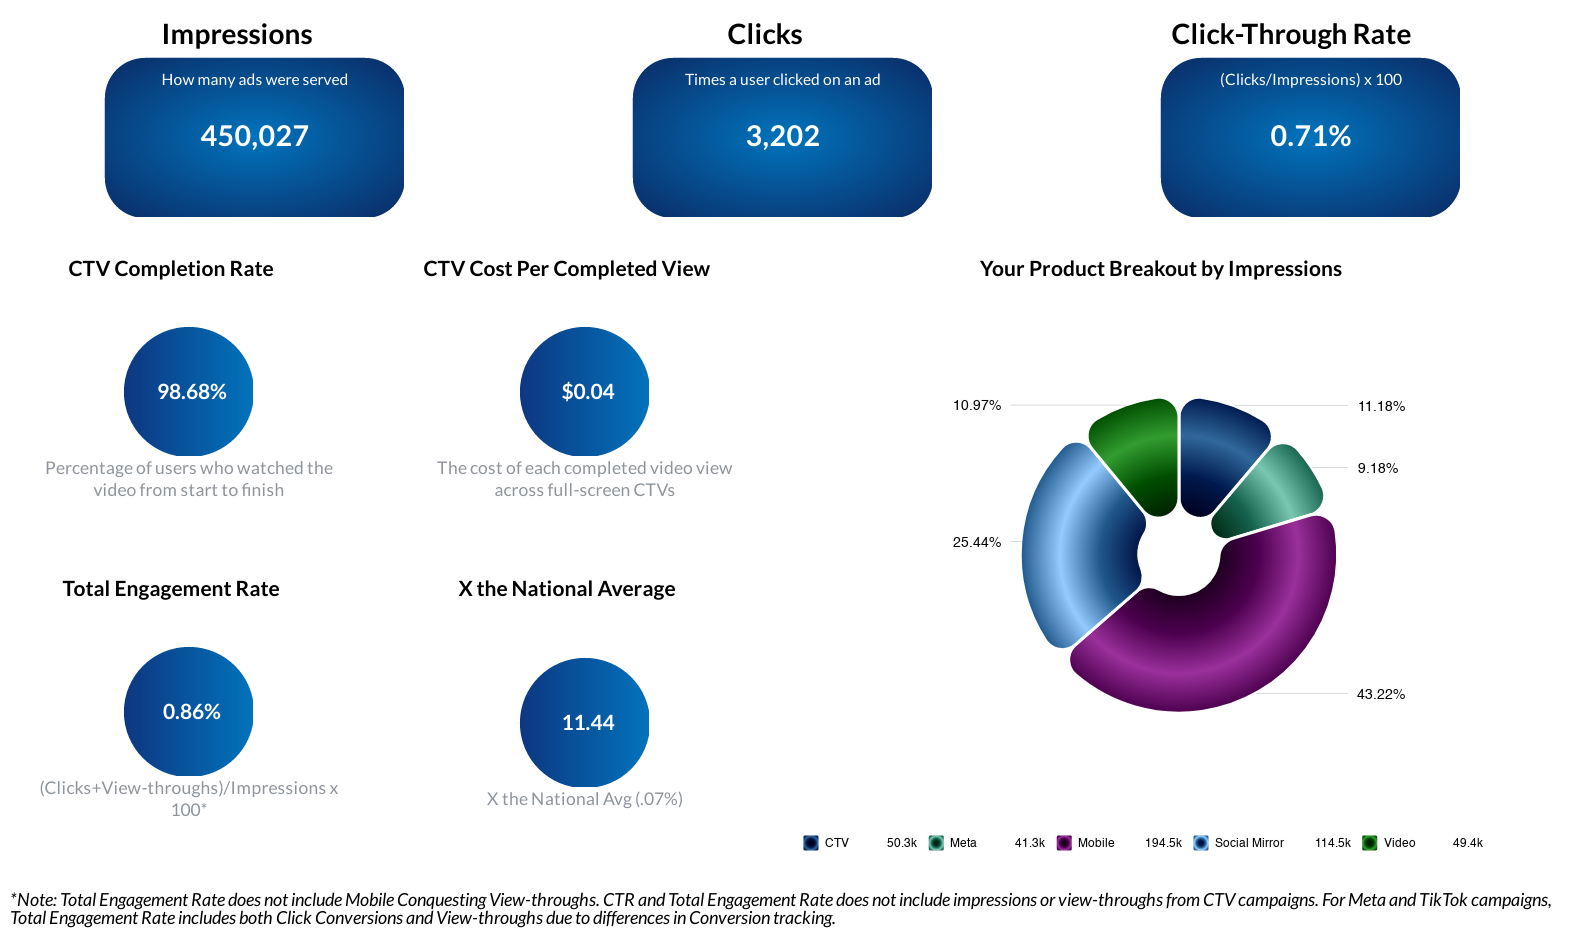
Don’t assume or take for granted the client remembers what they bought. Define their target audience back to them so they are reminded the impressions represent how many times real people who fit their customer profile saw their brand. Connect the dots for them. Using the above example, I would tell the client something like the below.
Durning the month of June, we served 450,027 ad impressions to adults with GI symptoms, or GI conditions across our digital product mix, which you see represented with the donut chart in the lower right-hand corner; we ran CTV, Meta, Mobile Conquesting, Social Mirror, and Video. These ad impressions were clicked a total of 3,202 times which landed them on (insert client’s landing page name), which represents a click thru rate of 0.71%. We benchmark ourselves against the national average for CTRs, which is .07% so this performed 11.44x higher than the national average. In addition to the over 3,000 clicks, there were people who didn’t click, but still came the website’s home page after being served the ad. This is what the total engagement rate is helping us measure, and we like to see an engagement rate that is higher than the CTR. During June, the campaign’s engagement rate was significantly higher than the CTR with 0.86% - fantastic! This is confirming we have a well-defined target audience that is engaging with the ad creative. The average completion rate for the CTV ad impressions was almost 99%, which is exceptional! We are looking for numbers above 90% here, and the average cost per completed view was only $0.04.
Tailor Metrics to the Product and Compare to Different Time Periods
Each advertising product comes with its own unique data. Understanding and explaining these differences is key. If the client is running a more robust campaign with multiple products, it can be helpful to remind them how the different products fit into a digital marketing funnel and how different products achieve different goals.
For example, the CTV ad impressions should be positioned as targeted branding and awareness, not a traffic generator via clicks, and not a conversion tactic. If the client is looking to measure in-store visits, Mobile Conquesting should be the primary focus.
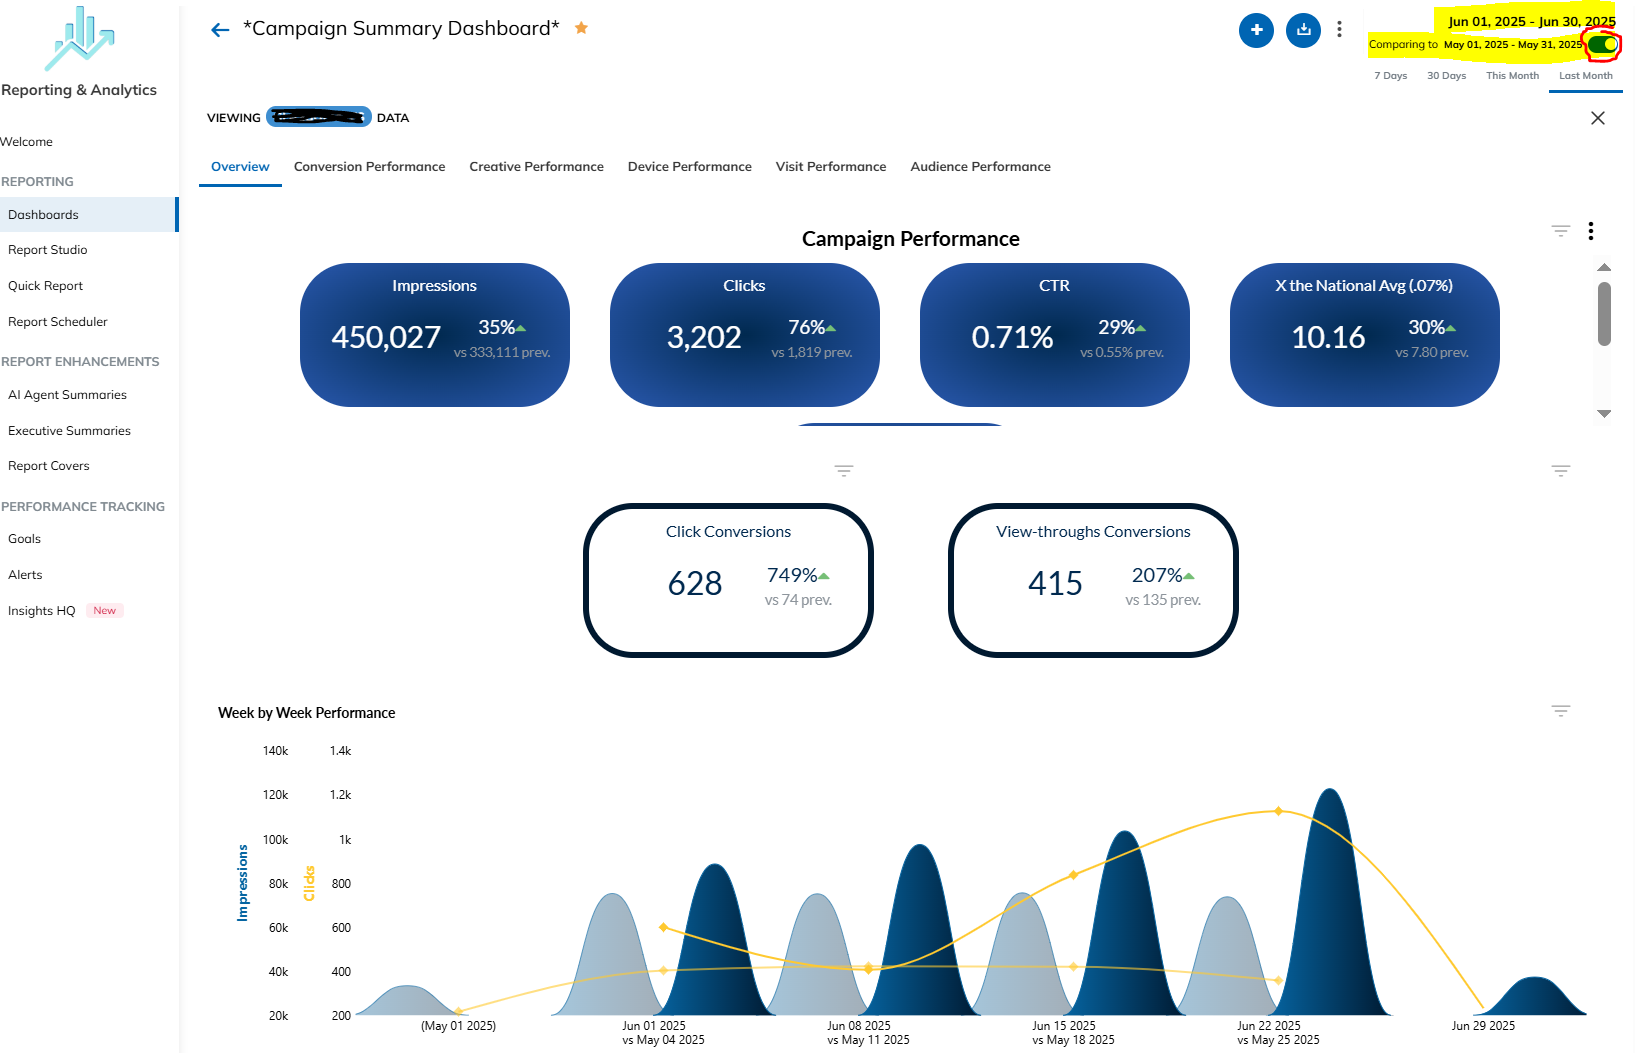
A great feature is the toggle the “compare to custom date range” in Reporting.Zone so you can quickly see how this month compared to last month, or this quarter compared to last, how this month compared to the same month the prior year, etc. RZ will automatically calculate both the total increase or decrease in numbers as well as a percentage change.
When I see a consistent decline in CTR the first thing I look at is the creative. Has it been running too long and the audience is getting creative fatigue? If so, a quick creative refresh can lift the CTR quickly.
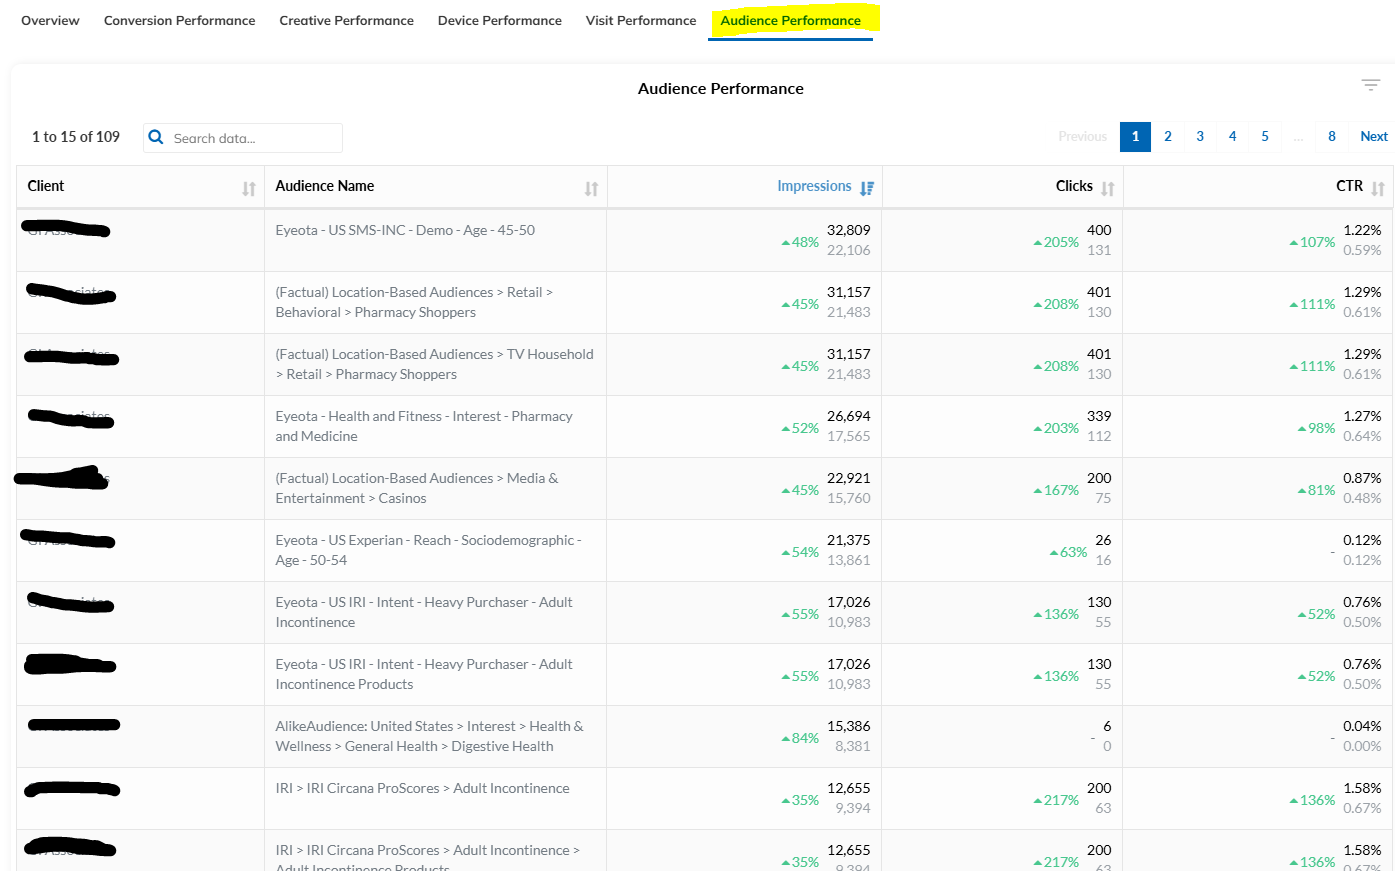
For any of the BARCK+ products, the Audience Performance tab in RZ can be really helpful. Is there a particular behavioral category driving the average down or up? Should we remove one, or try and find additional ones similar to top performing categories, etc. Need access? Get with your digital point person to share.
Don’t Skip the Supplemental Reports
In addition to standard metrics, many campaigns benefit from supplemental insights such as:
· On-Site Visit Tracking
· Additional Mobile Conquesting Reports (you need to request in your IO, not automatically provided):
o On-Site Visit Break Out By Geography: We can break out on-site visits by States, DMAs, or Zips Codes and also show impressions, clicks, as well as visits.
o On-Site Visit Break Out By Geo-Fence: If a client is doing geo-fences and wants to see a breakout of which geo-fence is sending them the most visits, we are able to break out visits by geo-fence.
o On-Site Visit Break Out New Visitor vs Returning Visitor: The reports will show of the on-site visits what were the number of new visitors (people who have not previously visited your location in the last 90 days) and previous visitors (people who have visited your location more than once in 90 days).
o DNA Report By Click: If we are Geo-Fencing areas, we can pull a DNA Report that shows top categories for people who were in the Geo-Fence that clicked on the ad (after the campaign has run 2 months or more).
o DNA Report By On-Site Visit: If we are Geo-Fencing areas, we can pull a DNA Report that shows top categories for people who saw the ad and then visited the client’s location
· Google Analytics Integration
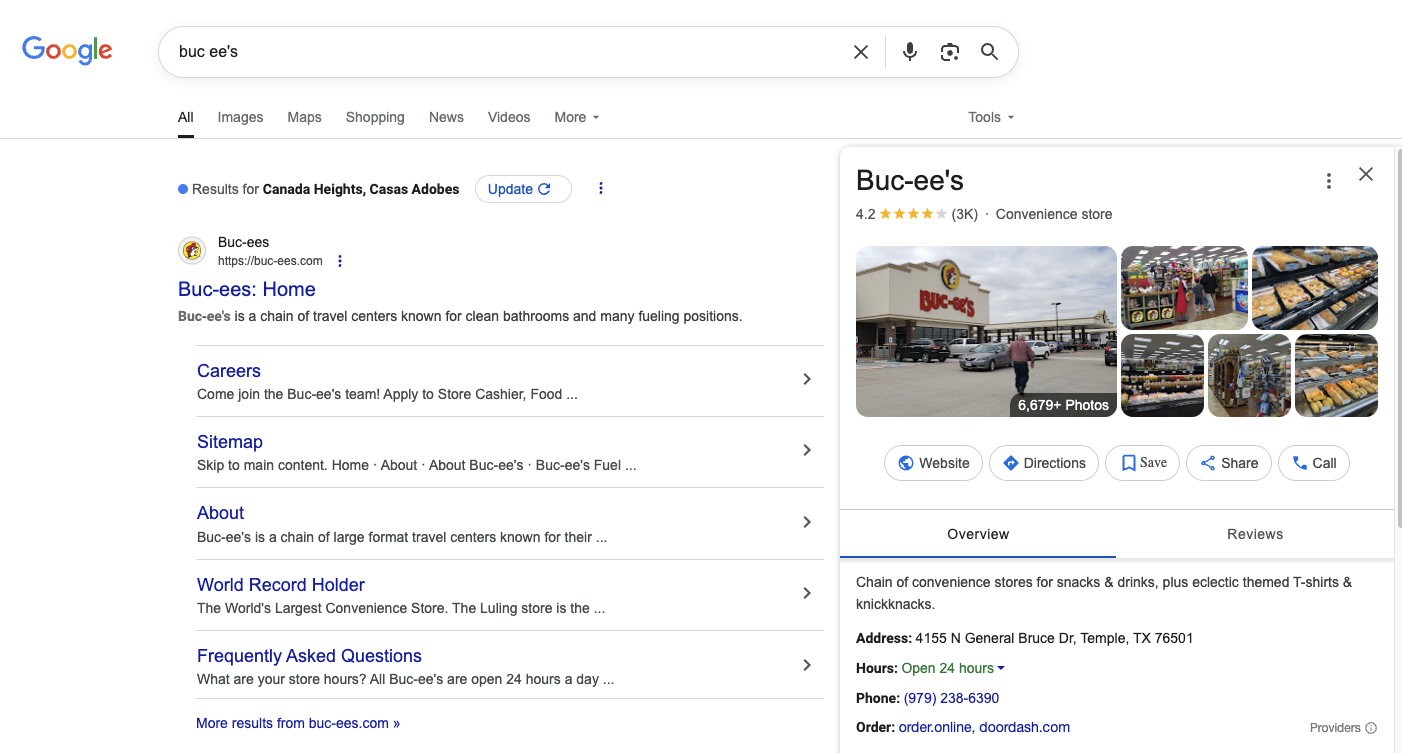
· Google Business Profile Integration – this is so underutilized! If your client has a GBP give them the Leadsie link to get this synced up TODAY! It is a great way to get more of the credit you deserve as many people view through to a GBP instead of their website’s homepage and will click to call or get directions from a Google Business Profile.
Go Beyond the Metrics
Data is powerful—but only when it’s connected to goals. In your review sessions, help your clients see:
· How the data aligns with their objectives
· What insights can be drawn
· What optimizations will be made moving forward
Help Clients Track Offline Lift
Encourage clients to supplement your reports with:
· Google Business Profile insights
· CRM and sales team feedback
· In-store observations
Educate as You Go
A key part of reporting is client education. Don’t assume your clients know what a CTR or view-through rate means—or why it matters.
Use analogies, metaphors, visual aids, or past campaigns to explain trends and performance. Humanize it.
Customize the Experience
Every client is different. Some want high-level summaries; others want to dive deep into the data. Tailor your reporting process to match their communication style and strategic goals.
Monthly reports are a powerful tool—if used correctly. By taking the time to explain the data, contextualize the results, and tie everything back to client goals, you do more than just prove your value. You become a trusted advisor, not just a vendor.
So, the next time you send a report, don’t just click “send.” Walk your client through the numbers. Tell the story behind the data. Celebrate wins and strategize the challenges.
Because the best client relationships are built not just on performance—but on clarity, collaboration, and communication.
Closing Advice
Keep it fun! Don’t take your clients willingly into the weeds. Keep them focused on the parts of the data you want to focus on. Metrics are like ingredients in a recipe—you don’t need all of them to make something delicious! But it’s important we be transparent, and provide all the ingredients, even if we don’t use them all 😉
Digital advertising reports are where numbers tell stories—and sometimes tall tales. If you can get your hands on a competitor’s reporting, share with your Vici Trainer and they can help you point out the weaknesses, and where ours can really shine.
.png)


